- Market Overview
- Futures
- Options
- Custom Charts
- Spread Charts
- Market Heat Maps
- Historical Data
- Stocks
- Real-Time Markets
- Site Register
- Mobile Website
- Trading Calendar
- Futures 101
- Commodity Symbols
- Real-Time Quotes
- CME Resource Center
- Farmer's Almanac
- USDA Reports
Pharma Giant Eli Lilly (LLY) Could Still Be a Screaming Deal—Here’s the Statistical Evidence

To be quite blunt, unusual options activity could be hit or miss. It’s possible that aberrant transactions in the derivatives space can tip off retail investors regarding potential moves. The problem, though, is that nothing is ever so easy on Wall Street.
Look, the reality is that if unusual options activity was inherently predictive, everyone would trade based on that information. However, if that were to happen, whatever opportunity that existed would be arbitraged to extinction. It’s a Catch-22. But with that caveat out of the way, retail players ought to look closely at pharmaceutical giant Eli Lilly (LLY).
At first glance, LLY stock doesn’t seem like a great idea for speculation. Since the start of the year, Eli Lilly — despite being a juggernaut in the broader healthcare ecosystem — has underperformed the main market benchmark, losing 2%. During the same period, the S&P 500 index has gained nearly 12%.
Adding to the skepticism, the Barchart Techncial Opinion indicator rates LLY stock as a 72% Strong Sell. From the perspective of market psychology, LLY has, according to the indicator, a weakening short-term outlook. Sure, in the trailing month, LLY is up over 10%. However, because the performance overall has been weak, there’s a legitimate concern that the security could soon fade out.
Still, the latest options activity might warrant further investigation. On the surface, last Friday’s total options volume of 45,716 contracts wasn’t positively remarkable as it represented a 47% decline from the trailing one-month average. However, on the same day, options flow — which focuses exclusively on big block transactions likely placed by institutional investors — carried different implications.
Essentially, net trade sentiment stood at $2.044 million above parity, thus favoring the bulls. What was most intriguing was that the biggest trade by dollar volume was for nearly $2.7 million worth of bought $500 calls expiring March 20, 2026.
With an ask of $268.50, the trade implies a push toward the psychologically important $800 level by expiration — and possibly more. Indeed, such a move could be statistically valid.
Past Price Behaviors Point to Sustained Growth
While LLY stock may be technically rated as a Strong Sell, the quantitative framework suggests that a bullish reversal could be in play. Basically, in the past 10 weeks, the market has voted to buy LLY six times and sell four times, yet the overall trajectory of this period was downward. That’s odd considering how accumulative sessions outweigh distributive, which would ordinarily imply a northbound trajectory.
However, the above sequence — which can be labeled 6-4-D for easy classification — historically represents a sentiment reversal. In my in-sample dataset (which runs from January 2019 to July 2025), past analogs reveal that the sequence generates an upward drift over the next 10 weeks. Indeed, this drift skews above what would normally be expected from an aggregate or baseline drift.
In terms of estimating probabilities, looking out two months ahead introduces expansions of error. Still, from the data that I have, I’m looking at about a 70% chance of upside 10 weeks following the flashing of the 6-4-D sequence.
Now, before we jump into a trade, we should note that the above statistical information is based on in-sample data. To get a better understanding of the probability of causality for the 6-4-D sequence — and not just an acknowledgement of correlation — we must conduct out-of-sample tests. Basically, we want to test the sequence on fresh data to account for exogenous factors potentially “corrupting” the signal.
Because LLY stock has a long history, I was able to conduct three tests — one test covering the 2000s decade, another test covering the 2010s decade and finally, a test to cover the post-pandemic period between 2022 and 2024.
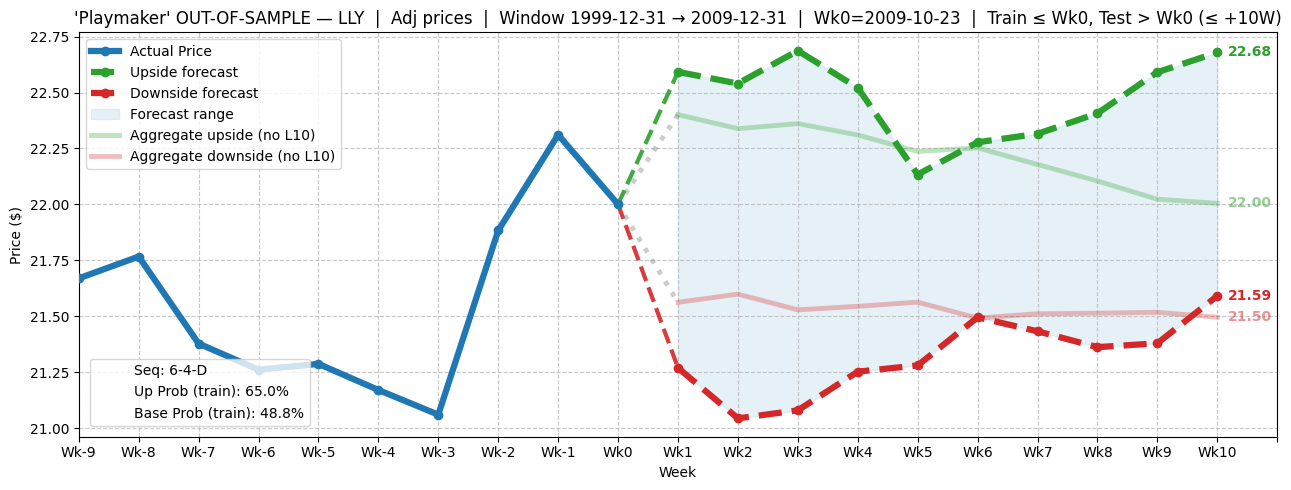
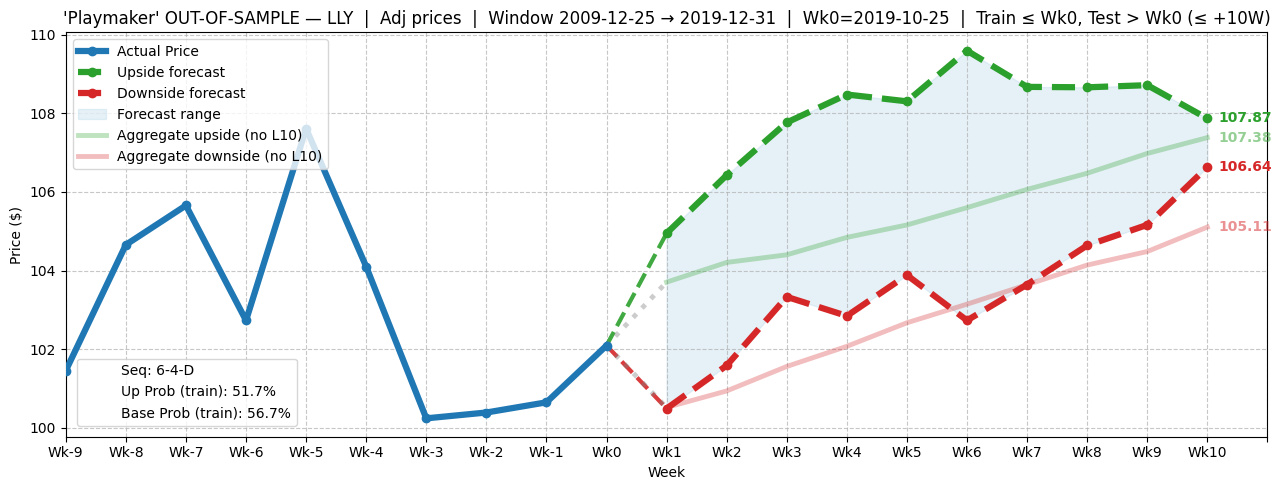
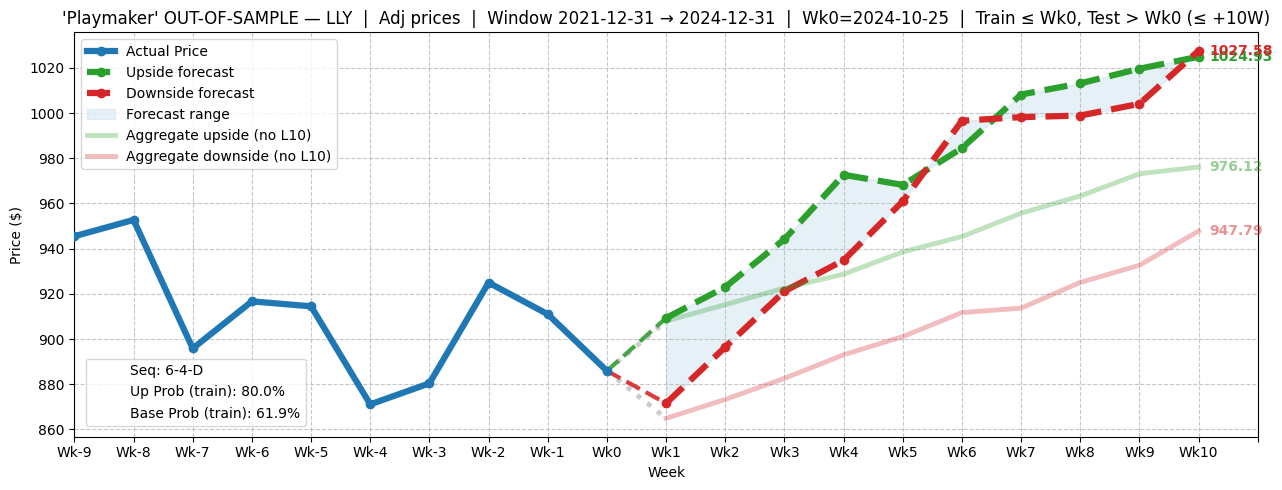
Of the out-of-sample analyses, the most recent time periods — the 2010s decade and the post-pandemic period — demonstrated that the 6-4-D sequence sparked a clear upside bias relative to aggregate or baseline expectations. That left the 2000s decade as the distinctly unusual signal because of the heightened choppiness.
Of course, the explanation is that the Great Recession did a number on market sentiment. Also, it should be noted that from the fifth week onward, both the positive and negative pathways associated with the 6-4-D sequence tilt higher.
All in all, then, the out-of-sample tests reveal a high probability of upside.
Playing the Numbers Game
Based on the market intelligence above, the trade that’s arguably the most tempting is the 780/790 bull call spread expiring Oct. 17. This transaction involves buying the $780 call and simultaneously selling the $790 call, for a net debit paid of $455 (the most that can be lost in the trade).
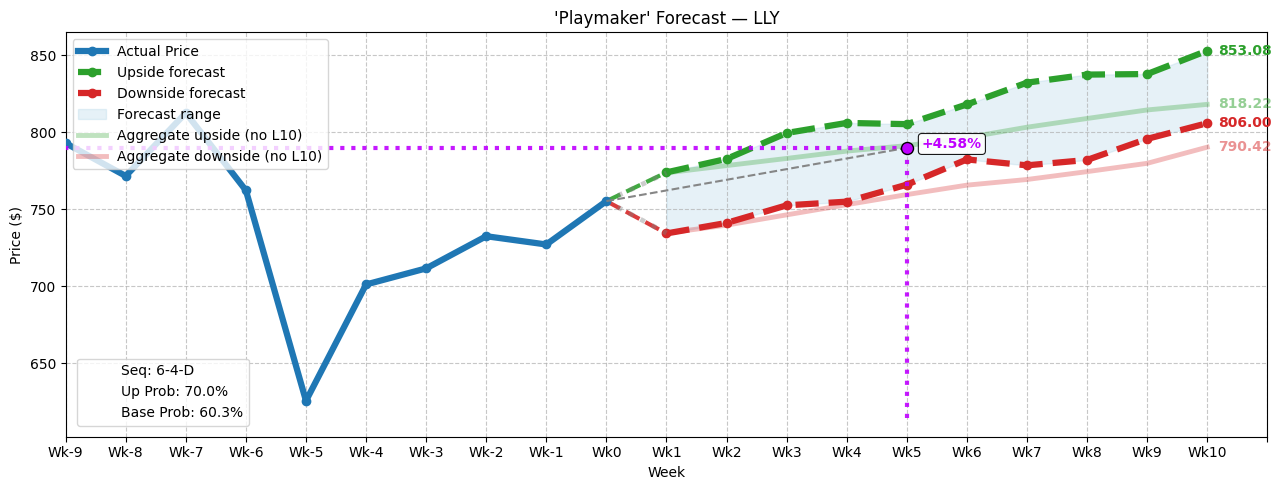
Should LLY stock rise through the second-leg strike price ($790) at expiration, the maximum profit is $545, a payout of nearly 120%. Breakeven sits at $784.55, which is 3.86% above Friday’s close of $755.39.
On paper, it may seem like an ambitious trade — and it is. However, I would also contend that it’s rational and realistic. With a $790 price target, LLY stock would be aiming for a price level that it would be expected to reach under normal bullish conditions. However, because of the 6-4-D sequence, the implied sentiment reversal suggests that this target is more reasonable than market makers currently anticipate.
On the date of publication, Josh Enomoto did not have (either directly or indirectly) positions in any of the securities mentioned in this article. All information and data in this article is solely for informational purposes. For more information please view the Barchart Disclosure Policy here.